

- Responsible for new idea generation; portfolio construction; risk management; due diligence
- 25+ years overseeing concentrated small-cap portfolios, on behalf of the most sophisticated allocators in the United States
- Previously: Founder, Endowment Capital Group; Portfolio Manager, Downtown Associates; Analyst, W.H. Newbold’s Son & Company
- University of Pennsylvania, Wharton School, B.S. 1986
- Married to Isabella, 3 sons, 3 daughters, 2 dogs
by Owls Nest Partners on Sep 30, 2020
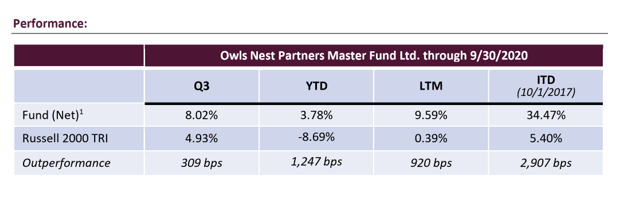
Performance:
Holdings as of 9/30/2020:
We ended Q3 2020 approximately 88.5% invested (the value of our long positions less the value of any shorts), and with the following holdings (long positions, largest to smallest position size):
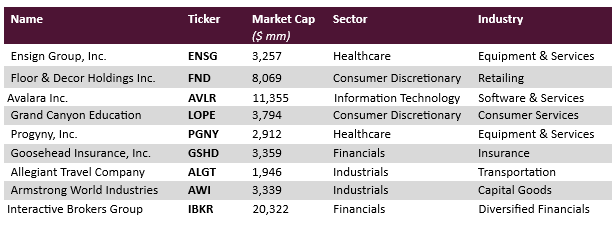
Median Total Debt/Market Cap: 3.4%
Median Market Cap: $3,359 million
Active Share vs. Russell 2000: 99.7%
[2] Past performance is not indicative of future results. All returns are presented net of all fees that would be paid by any Owls Nest Partners Concentrated Long Only SMA client, and are preliminary, unaudited, figures that are subject to change. Actual client returns may be different from returns presented herein.
Quarterly Attribution:
We had six stocks that were gainers in the quarter. Gainers, in order of largest impact to smallest, were Ensign Group (ENSG), Floor & Decor (FND), Goosehead Insurance (GSHD), Progyny (PGNY), Interactive Brokers (IBKR), and Allegiant Travel (ALGT). In the quarter we had four detractors which were, in order of largest impact to smallest, Grand Canyon Education (LOPE), Armstrong World Industries (AWI), Avalara (AVLR), and Affiliated Managers Group (AMG) which was exited during the quarter.
Portfolio Adjustments:
We had, by our standards, an active quarter as we took advantage of volatility to move dollars to where we think they could garner the greatest value and firepower to drive performance for the next couple years. We established a new position in Armstrong World Industries, Inc., discussed below, and we added meaningfully to both Grand Canyon Education and Progyny. We also added to our positions in Ensign Group, Interactive Brokers, and Allegiant. Meanwhile, we pared our positions in Goosehead Insurance (on the back of very strong performance) and Avalara.
During the quarter, we exited our position in Affiliated Managers Group (AMG). Our decision to sell largely comes down to two words: Opportunity Cost. AMG remains a leader in its field with ample opportunity to grow by acquisition, and an underleveraged balance sheet and generous free cash flow to fuel that growth. It has a high caliber management team with the correct long-term incentives. Its valuation is stupid cheap. But, for the foreseeable future at least, it lacks the essential ingredient to make the stock work: Growth. Organic growth is problematic as it wrestles with the decline of its once large and highly profitable affiliate, AQR. However, the bigger problem is the inability to execute the inorganic growth strategy centered on majority investments in new affiliates. The flywheel stopped a few years back due in part to rising valuations and a distracted management team dealing with the unexpected illness and subsequent death of the company’s leader.
The problem with relying on acquisitions for growth and having to compete for those deals is that if your stock price falls for any reason, your cost of capital increases. This, in turn, makes it harder for you to pay market prices for deals which then, in turn drives your stock price lower. The vicious cycle makes the “successful inorganicgrowth-driven value stock” rarer than anything Marlin Perkins and his trusty sidekick Jim ever pursued (Google them if you are under 50). So while AMG stock is absolutely cheap, and while it’s easy to imagine it grinding higher until the underlying value is ultimately realized, we think we can invest our capital in companies with stronger market positions and clearer and greater growth opportunities. The sell decision also includes an element of portfolio construction. We added Interactive Brokers (stronger market position, clearer growth prospects) to the portfolio in Q2, and holding AMG as well would give us a greater weighting than we presently want in financial stocks. Lastly, the sale gave us a chance to realize some losses to reduce tax liability and give us greater flexibility to realize gains as need be in the future. In fact, as of this writing, we have significant negative realized gains on the year despite our very positive performance. This means after tax returns will actually be higher than the reported results in the aggregate for the fund.
Armstrong World Industries, Inc.:
Two of the most common (and logical) questions we get from new, prospective investors are: 1) is there a template you follow when choosing investments, and 2) how do you source your ideas? The story of our new investment in Armstrong World Industries (ticker AWI) is an excellent illustration of the answer to those two questions.
Answer number 1 – yes. The best mouse trap in the industry. The uniqueness, durability, and expansibility of the superior mouse trap, which is verifiable through scores of phone calls and meetings with competitors, suppliers, distributors, former executives, influencers, and most importantly customers. An “Aha!” moment when we realize why the company’s structural advantages effectively make it impossible for existing competitors to catch up. A liquid and underleveraged balance sheet providing downside protection to investors, but more significantly allowing the company to go on offense during a downturn when competitors have to cut back and when return on those investments (acquisitions, hiring talent, new product innovation) are the highest. Respect for what Ben Graham identified as the worst mistake an investor could make (Chapter 20 of Intelligent Investor) – buying a company’s securities while it enjoys an unsustainable tailwind. The unsustainable headwind on the other hand allows for buying companies when their moat is expanding rapidly, and when fundamentals and market sentiment are coiled providing protection and the full upside potential. Note, however, that this approach requires copious un-automatable “pick and shovel” work, brings abundant tracking error and necessitates a modest degree of patience, so it is not for everyone. Which is fine by us.
Answer number 2 – we find ideas in many ways including the standard processes of running screens, sifting through Wall Street research, and relentless networking. After all, it is important to keep systematically expanding the universe of researched potential investments. But the best source of new ideas is the scuttlebutt method borrowed from Phil Fisher (Common Stocks, Uncommon Profits). All our efforts are focused on finding great companies uniquely solving large problems through the lens of real economy customers. We are not ivory tower analysts. So nothing sets our heart a flutter, as much as, “well, I have this new supplier who is doing amazing things and lowering my costs dramatically and solving my problems in ways no one else could and I expect they will continue to do so for a long time.” That’s our definition of striking gold, and it is why every conversation we have, whether with an Uber driver or CEO, always includes the question: “who out there is doing anything special for you?”
Two years ago, while doing the work on Floor and Decor, we had to talk to various flooring manufacturers as part of our diligence. Armstrong used to have a significant flooring business which it spun out as a separate public company, Armstrong Flooring Inc., in 2016. Our thesis was that flooring manufacturing was a tough business with tremendous global competition, no pricing power, and little brand equity – which plays perfectly into the hands of the person selling the product to the tens of millions of Americans fixing up their homes in any given year. Everyone we talked to who knew the flooring business – including a very honest C-Level executive at Armstrong Flooring – said two things. “Your thesis is valid. This is a tough business. Floor and Decor will kill it and seize much of the profitability in distribution of flooring like Google does in the connecting of people with information.” Then they added, “This is why Armstrong World Industries was brilliant to spin out their flooring segment, even though it is a difficult decision to jettison your oldest line of business. Now they can focus entirely on the ceiling business where they dominate, and which is an absolutely amazing business.” Eureka! There’s gold in them thar words. Now we had to understand, further verify, and wait for the unsustainable headwind.
Armstrong’s business consists of two primary parts: mineral fiber ceilings, which are the standard tiles resting in a suspended grid; and specialty ceilings, which are the stylized ceilings you might see in lobby areas made of wood, steel, felt, or other materials. Armstrong is also the leader in ceiling grid systems through their WAVE joint venture with Worthington Industries. Specialty is a newer business and an important incremental long-term growth driver, but the primary business is mineral fiber where Armstrong is by far the U.S. leader in suspended ceiling systems for commercial applications. This is a very unsexy business, unless you get excited by things like greater than 50% market share, 35%+ returns on tangible investable capital, and a 21 billion (yes, with a B) square foot installed base fueling a never ending repair and remodel annuity stream.
The main drivers of their superior economics are four-fold. First, every new commercial building involves an architect that specifies what goes into the space including the ceiling manufacturer and even the tile number. Price of course, matters, but end customers understand the value in paying a modest premium for leading features, functionality, quality and durability especially as the cost of a ceiling in the grand scheme of a project is almost insignificant. And with his reputation at stake, the architect wants to work with the undisputed leader who invests the most into product innovation, territory service coverage, digitalization (to make the architect’s life easier), and the broadest product portfolio. Second, Armstrong controls distributions through exclusive dealers. In fact, a foreign company trying to break into the U.S. market some years ago failed so badly in their attempt to get meaningful distribution that in desperation they chose to launch an ultimately unsuccessful suit against Armstrong on anti-trust grounds. The upstart remains a bit player, and their travails continue to warn others of the challenges of competing with Armstrong. Third, with their focus narrowed to ceilings Armstrong has been on a relentless drive to innovate and drive lower costs. With their scale, they can invest in R&D like no one else, and the evidence of their success is that the share of their sales from products introduced in last 5 years has grown to 40% from less than 10% a decade ago. New features, mix changes, and market position strength have also driven increased pricing which has risen roughly 6% per year since 2006. Similarly, investing in manufacturing and operational efficiencies has allowed operating margins to expand from 13% to 23%.
Lastly, the heart of the business and the characteristic that appears least understood today is that this is primarily a repair and remodel business. The vast majority of that massive installed base will need to be replaced at some point, and because the Armstrong product was specified to begin with and because the replacement product needs to fit into an Armstrong grid system, Armstrong enjoys a growing and predictable replacement revenue stream which allows them to maintain the investment in innovation and exclusivity of their distribution network. This, in turn, continually widens their moat.
Great business, sure. But why now? COVID is a very significant headwind to the business, and it will continue to be for some time. New construction of commercial space will be on an extended pause as developers let the dust settle to see what the world looks like post COVID. The repair and remodel business has slowed for the same reasons and because of the inability to safely schedule contractors to get work done. No wonder AWI shares closed out Q3 still down 1/3 from their price immediately before COVID.
But the downturn also accelerates Armstrong’s ability to seize long-term opportunities in all areas of its business. Whereas Armstrong dominates mineral fiber ceilings, the specialty ceiling market is extremely fragmented consisting mostly of family run businesses with less than $25M in revenue. The specialty ceiling industry is roughly the same size as mineral fiber (measured in dollars as opposed to square feet), and while Armstrong has many leverageable advantages including distribution, technology and relationships with architects, its ownership of less than 20% of the market at this time gives it huge growth opportunities. Armstrong is growing their specialty business organically, but they are also growing rapidly by deploying their significant free cash flow in acquisitions of smaller specialty ceiling designers and manufacturers who have been successful with developing a unique product and who have earned a good reputation and market presence, but who have maxed out what is realistically achievable with current managerial and financial resources. Win-win deals allow these businesses to operate as part of the Armstrong family and allow Armstrong to take these businesses to the next level as Armstrong invests in their capabilities and plugs them into their distribution network. This strategy even helps the mineral fiber ceiling business as Armstrong can increasingly be a one-stop shop with the broadest offering of ceilings of all types. With advent of COVID, many entrepreneurs are losing the stamina needed to wait for the market recovery, and the acquisition opportunity set is rapidly expanding and terms are improving.
As such, their ability to grow their specialty ceiling business is greatly benefitting from this downturn.
COVID will also greatly accelerate the existing trend toward more feature-rich, higher-priced and more profitable mineral fiber ceilings. Put yourself in the position of the commercial property owner. Your number one goal has to be to convince people it is safe to use your space, whether it is an office, healthcare facility, educational facility or retail store. Additionally, you have to proactively work with clients to reconfigure the space for new use cases and deal with the inevitable great reshuffling of space. The alternative is maintaining status quo and hoping for the best, and that is not an option.
One of the most cost-effective ways to convince tenants that it is safe to return is to replace the ceiling. For most applications, ceiling innovation has mostly been about acoustical control where it is essential and easing the design and installation process. However, Armstrong has extensive and technical leadership in much more demanding environments like operating rooms and clean rooms for pharmaceutical and semiconductor manufacturers. As a result, they have a portfolio of products that are antimicrobial and easy to clean, that seal rooms to prevent air and pathogens flowing from one room to another, or that dramatically increase fresh air flow and HVAC efficiency.
For example, in almost all instances it is prohibitively expensive to replace windows with new windows that open or to upgrade existing HVAC systems to significantly increase fresh air flow. But Armstrong’s new AirAssure product provides a significantly tighter seal and can increase fresh airflow by 40% without any changes to the HVAC system. It can also be integrated to include their UV light system to kill pathogens. Thanks to COVID, products such as these and others currently in design will soon go mainstream and the implications for pricing, margins, and earnings are extremely positive.
We want to own companies that are solving large complicated and difficult problems in ways no one else can. American commercial landlords, their tenants, healthcare facility operators, high-tech manufacturers, all face new and daunting, even existential issues with design, efficiency, and safety of their facilities. Armstrong uniquely provides an integral part of this solution.
Don Shula on Investment Discipline, Portfolio Construction, Concentration, and Capacity Constraint:
“Don Shula can take his'n and beat your'n, or he can take your'n and beat his'n.”
~ NFL Head Coach Bum Phillips on Don Shula
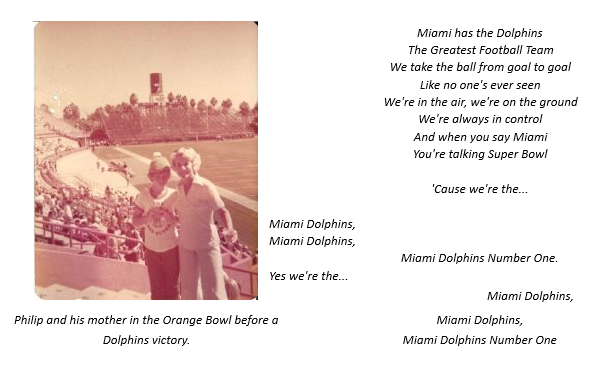
Until I went to college, every combination I used for a lock was a series of zeros by 39 or 42. These numbers held special significance as the uniform numbers of the two primary offensive weapons for the Super Bowl Champion Miami Dolphins teams of the 1970’s, Larry Csonka and Paul Warfield. Csonka and Warfield were great players and ultimately Hall of Famers, but their greatest success came as a result of the coaching and versatile game planning of Head Coach Don Shula.
Opposing defenses would get beaten down with a steady diet of Csonka up the middle. When they adjusted to defend against that, Shula would run Mercury Morris outside. And when the defense adjusted to that, he’d throw the ball deep downfield to Warfield. It was a beautiful example of excellence, discipline, execution, and flexibility.
Shula believed strongly that you could not be one dimensional and that your attack depended on the situation and the defense you faced. That lesson remains important in football. It is also vital, in our opinion, in the world of investing. This belief has greatly informed our approach which we have, as it were, structured to gain as many yards as possible without risking turnovers. In our case, we use capacity constraint, concentration, eclectic mixing of uncorrelated stocks to avoid overweights to any single investment style, and a strict discipline around quality, growth, and price to generate the greatest long-term performance we can while seeking to avoid the risk of permanent capital loss.
This approach has allowed us, historically, to greatly outperform the relevant indexes over time.[1] We believe our combination of companies with their vastly different correlations to the economy and with the very different positions in the value/growth style box continuum that stock market traders and consultants apply (or different “factors” as the more modern and mathematically advanced see it), protect us from the risk of getting too concentrated in one area or style, which often works until it doesn’t leading to a losing final score.
I have always been confused when people speak of “the market”. After all, I view the world of publicly-traded stocks not as some monolithic single thing to trade but as thousands of very specific markets in the shares of individual companies, some of which are in raging bull markets and at atmospheric valuations, while others are in the throes of their own bear market. Having to bet on the market – and with it owning sundry cats and dogs and fads and overly popular and over-valued companies – is the sad by-product of the overselling of diversification and the world of too many assets being overseen by too few massively overscaled investment behemoths. Owning the market gives you one play to run, which works at least adequately well against certain “defenses” such as declining interest rates, but which struggles against others. By limiting our asset size we provide ourselves with the broadest universe of possible companies to invest in, and by concentrating our capital in a portfolio of only ten outstanding companies, we can pick with impact the play that exploits the mismatch we see on the field at that moment. Like Don Shula did. Owning the market has been highly profitable since July 1982, with the S&P Index up nearly 12-fold in that time. However, the 28 years or even the 45 years or even the 54 years before that July 1982 low actually saw the index move lower. What do the next ten years hold? Who knows? But we are certain that there will be opportunities for the nimble investor with a broad playbook. And emotional and volatile markets when they happen along the way, simply make the mismatches we can exploit even more pronounced.
At any time, certain companies are dangerously overpriced while others are extremely cheap. The greatest example in my career that I was able to exploit was the height of the internet/dot.com bubble when fluff businesses went from billion dollar valuations to out of business in 12 months while real businesses, especially retailers were neglected and dirt cheap. eToys went to zero, but CarMax has been about a 150 bagger since it was discarded as a simple brick and mortar retailer.[1] Lofty valuations and the expectations implied in those valuations are the equivalent of triple coverage on a receiver. Don’t throw it to that guy. Instead, that attention generally means someone else is left uncovered.
A disciplined focused on buying great companies with visible runway for growth, at a value entry point during a temporary headwind allows us put money to work where we believe the greatest and safest opportunity is at the time. And, importantly, it simultaneously can allow one to sell advantageously too. If you are stuck in a style box – whether it’s “value”, “growth”, “GARP”, “rising dividends”, “low volatility”, or any market cap class – you can’t call the best play when it is outside of your chosen (or third-party designated) box. And if you are limited to any industry or sector, you miss opportunities outside that area and you risk losing objectivity and staying too long at the punch bowl when that area is in favor. To the man with only a hammer, everything looks like a nail. We do not care about consultant-driven orthodoxy. Instead, we invest as if it is our money at risk and we want it invested where there is the greatest opportunity to grow it over time. Because it is, and we do.
Don Shula passed away earlier this year, but his genius and versatility continue to inspire. This is, after all, a guy who made it to the Super Bowl with quarterbacks as different as Dan Marino and Earl Morrall, and even the long-forgotten David Woodley. He had unwavering principles and discipline (almost always the least penalized team in the league by the way), but it was his creativity and flexibility that made him the winningest head coach in NFL history. And we hope those same characteristics will make Owls Nest Partners by far your best performing investment over any full investment or economic cycle.
Closing Thoughts:
We hope you and your family remain safe and well. More than ever, we thank you for your support and for choosing to have your money working alongside ours.
Gratefully,
Philip, David & the Owls Nest Partners team
[3] Of course, past performance is not indicative of future results.
[4] This is not a recommendation to purchase CarMax and the reference here to CarMax is for illustrative purposes only. No strategy at Owls Nest Partners has historically, nor do any strategies currently, own CarMax.
Disclaimer
In General: This disclaimer applies to this document and the verbal or written comments of any person presenting it. This document has been prepared by Owls Nest Partners IA, LLC as Investment Adviser (the “Adviser”) of Owls Nest Partners Concentrated Long Only SMA (the “Strategy”). By receiving this document you acknowledge that you are an investor in the Strategy, or a prospective investor who is known to the Adviser, and that you meet all regulatory definitions of “Accredited Investor” and “Qualified Client,” in order to be considered a prospective client of the Adviser. The information included herein reflects current views of the Adviser only, is subject to change, and is not intended to be promissory or relied upon. There can be no certainty that events will turn out as the Adviser may have opined herein.
No offer to purchase or sell securities: This document does not constitute an offer to sell (or solicitation of an offer to buy) any security and may not be relied upon in connection with the purchase or sale of any security.
No reliance, no update and use of information: You may not rely on this document as the basis upon which to make an investment decision. To the extent that you rely on this document in connection with any investment decision, you do so at your own risk. This document is being provided in summary fashion and does not purport to be complete. The information in this document is provided you as of the dates indicated and the Adviser does not intend to update information after its distribution, even in the event the information becomes materially inaccurate.
Knowledge and experience: You acknowledge that you are knowledgeable and experienced with respect to the financial, tax and business aspects of this presentation and that you will conduct your own independent financial, business, regulatory, accounting, legal and tax investigations with respect to the accuracy, completeness and suitability of this information, should you choose to use or rely on this document, at your own risk, for any purpose.
No tax, legal or accounting advice: This document is not intended to provide and should not be relied upon for (and you shall not construe it as) accounting, legal, regulatory, financial or tax advice, or investment recommendations. Any statements of U.S. federal tax consequences contained in this document were not intended and cannot be used to avoid penalties under the U.S. Internal Revenue Code or to promote, market or recommend any tax-related matters addressed herein.
Confidential information and distribution: By accepting receipt or reading any portion of this document, you agree that you will treat all information contained herein confidentially. Any reproduction or distribution of this document or any related marketing materials, as a whole or in part, or the disclosure of the contents hereof, without the prior written consent of the Adviser, is prohibited.
Suitability: Any investment program involves a high degree of risk and is suitable only for sophisticated investors who meet certain other suitability standards.
Investment strategies, market conditions and risk disclosures: Notwithstanding the general objectives and goals described in this document, readers should understand that the Adviser is not limited with respect to the types of investment strategies it may employ or the markets or instruments in which it may invest. Over time, markets change and the Adviser will seek to capitalize on attractive opportunities wherever they might be. Depending on conditions and trends in securities markets and the economy generally, the Adviser may pursue other objectives or employ other techniques it considers appropriate and in the best interest of the Fund. No representation or warranty is made as to the efficacy of any particular strategy or actual returns that may be achieved.
Projections: This document may contain certain “forward-looking statements,” which may be identified by the use of such words as “believe,” “expect,” “anticipate,” “should,” “planned,” “estimated,” “potential” and other similar terms. Examples of forward-looking statements include, but are not limited to, estimates with respect to financial condition, results of operations, and success or lack of success of the Strategy’s investment strategy. All are subject to various factors, including, but not limited to general and local economic conditions, changing levels of competition within certain industries and markets, changes in interest rates, changes in legislation or regulation, and other economic, competitive, governmental, regulatory and technological factors affecting a portfolio’s operations that could cause actual results to differ materially from projected results.
PAST PERFORMANCE IS NOT INDICATIVE OF FUTURE RESULTS
Disclosures
- Performance presented from inception through September 2020 is for a representative account of the Owls Nest Partners Concentrated Long Only SMA strategy (the “Strategy”). As of October 2020, performance is for a composite of separately managed accounts managed in accordance with the Strategy (the “Composite”). Performance is presented gross and net of all fees, as of the date listed at the top of this document. The fees applied are the prevailing fees of the Strategy at the time such performance was generated. From inception to the date of this document, the fee structure applied is a 1% annual management fee, and 15% performance fee that is charged only on the outperformance of the Strategy to the Benchmark (as defined below), and only after five years. Performance fees are accrued monthly. The vehicle for the Strategy is a separately managed account. All performance is calculated by the Adviser. Further information regarding the Strategy or the Composite can be provided upon request. The Adviser does not claim compliance with the GIPS reporting standards and the performance presented herein has not been audited or verified by any third-party. The Russell 2000 Total Return Index (the “Benchmark”) is a broad market index that is presented for comparative purposes as the performance benchmark to the Fund. The Benchmark is an unmanaged index consisting of the smallest 2000 stocks in the Russell 3000 Index. The stocks are issued in the United States, and the Benchmark includes the reinvestment of all dividends and income. Because the Benchmark is unmanaged, it assumes no transaction costs, management and performance fees, or other expenses. Unlike the Fund, it contains only domestic companies and is rebalanced monthly. Therefore, while the Benchmark contains publicly traded companies, it does not purport to represent an exact performance comparison to the Strategy. It is not possible to invest directly in an index, such as the Benchmark.
- The Russell 2000 Total Return Index is the performance benchmark for the Strategy (the “Benchmark”). The Benchmark is a domestic equity market index of the 2,000 smallest companies by market capitalization in the Russell 3000 Index. Because the Benchmark is unmanaged, it assumes no transaction costs, management fees or other expenses. The calculation of the benchmark return includes the reinvestment of all dividends. It is not possible to invest directly in an index, such as the Benchmark, and therefore it is presented here for information purposes only.

