

- Responsible for new idea generation; portfolio construction; risk management; due diligence
- 25+ years overseeing concentrated small-cap portfolios, on behalf of the most sophisticated allocators in the United States
- Previously: Founder, Endowment Capital Group; Portfolio Manager, Downtown Associates; Analyst, W.H. Newbold’s Son & Company
- University of Pennsylvania, Wharton School, B.S. 1986
- Married to Isabella, 3 sons, 3 daughters, 2 dogs
by Owls Nest Partners on Sep 30, 2022
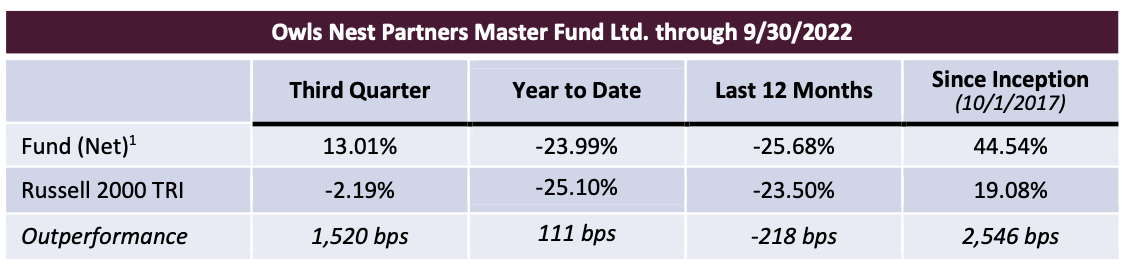
Performance:
Holdings as of 9/30/2022:
We ended Q3 2022 approximately 97.3% invested (the value of our long positions less the value of any shorts). We ended the quarter with the following holdings (in order of position size, largest to smallest):
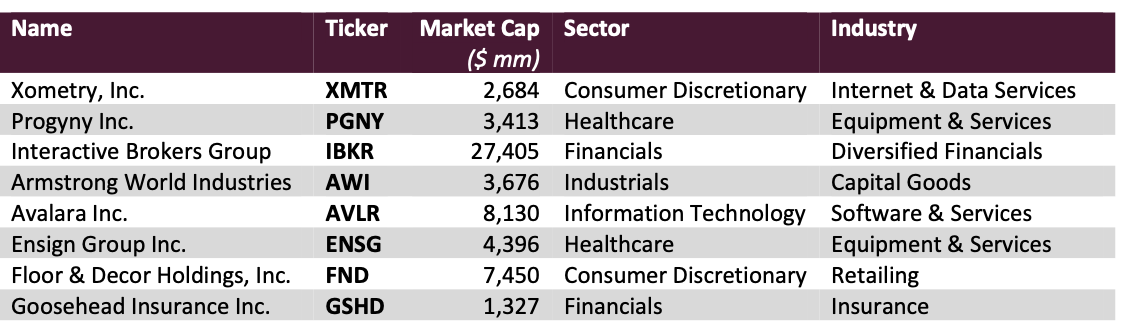
Median Total Debt/Market Cap: 9.6%
Median Market Cap: $4,036 million
Active Share vs. Russell 2000: 99.6%
1Past performance is not indicative of future results. Performance presented from inception through September 2020 is for a representative account of the Owls Nest Partners Concentrated Long Only SMA strategy (the “Strategy”). As of October 2020, performance is for a composite of accounts managed in accordance with the Strategy (the “Composite”). Please see the Disclosures at the end of this document for further information with regards to performance.
Quarterly Attribution:
We had seven stock prices advance and two decline. The largest contributor was Xometry followed by Avalara and Progyny. Repay and Goosehead were our decliners.
Xometry reported great Q2 results. The highlights included an acceleration in marketplace revenue (up 17% over the previous quarter and 55% over Q2 2021), impressive marketplace gross margin growth (up to 29.2% from 27.4% in Q1 2022 and barely 20% in Q2 2021), new product rollouts to make accessing the marketplace easier for both buyers and sellers and record new buyer additions.
Avalara was our second largest contributor as a result of announcing a deal to be acquired by private equity firm Vista Equity Partners. The purchase price is nearly three times the price of where we built our core position, and we also took some money off the table along the way at higher prices. Nonetheless, we are disappointed in this result. We were not surprised by the intent to sell the company, but the timing – during a deep bear market in software – made no sense for a company with a straightforward growth plan and a large untapped market and led to a price which we believe significantly undervalues the company. On the bright side, we have a strong portfolio at very attractive prices to reinvest the proceeds when the deal closes in Q4.
Progyny reported strong earnings with gross margins hitting a new high. Importantly it also had positive things to say about their selling season which was winding down and gives strong visibility into next year’s revenue growth which should exceed 30% on top of this year’s 50%+ revenue growth.
Repay is wrestling with a short-term headwind from decreased issuance of consumer loans which slows down their ability to process electronic payments on those loans. The world of personal loans and B2B payments is inexorably moving from paper to electronic payments, and Repay will be there to facilitate that transition. But in the interim they had to shave their expectation for internal gross profit growth for the year from 20% to 15%. The long-term adoption of electronic payment methods, however, continues unabated.
ven though its stock price declined as the market fixates on short-term macro concerns, primarily around housing, Goosehead had as strong of a quarter as we could have hoped for. Goosehead attracts customers in many ways, but the most cost-effective way is through relationships with real estate agents and mortgage brokers who recommend them to new buyers because of their great pricing and the breadth of available coverage. A housing slowdown like what we are currently experiencing is undeniably a headwind for Goosehead, but the company has other arrows in their quiver and the powerful advantage of a substantially better consumer offering. Proving the point, policies in force have grown by 35% over the last year showing the resiliency of the business. When you are building a huge, growing annuity of renewal commission revenue as Goosehead is, policies in force is the metric that matters.
As we will discuss later, Wall Street has turned its focus from growth to near-term profitability, in a change that we, as investors in great businesses as opposed to speculators and trend guessers, welcome. At present, however, Goosehead has some profitability headwinds as they invest in their leading digital offering and there has been a dramatic reduction in “contingent commissions” which are effectively bonuses paid by insurance carriers to their brokers based on the profitability of their business. The last twelve months have been the least profitable in a generation for personal lines insurance underwriting. Obviously, carrier underwriting practices, inflation, forest fires, hail, and an increase in accidents and big weather events have nothing to do with Goosehead’s prowess as an insurance agent. The growth in policies in force proves their strength. However, with industry profitability down, these bonus commissions are greatly reduced which has an outsized impact on earnings since there are no costs associated with them and they fall straight to the bottom line.
But, the answer to low profitability for carriers is higher rates which is ultimately a triple boon for Goosehead. Higher rates lead directly to higher commissions since commissions are paid as a percentage of premium. Higher rates lead to more consumers shopping for insurance which disproportionately helps Goosehead and accelerates their share gains at the expense of the large captive insurers like State Farm and Allstate since Goosehead represents more than 150 carriers and that breadth of choice almost inevitably leads to better prices for end consumers. And higher rates ultimately restore profitability for the carriers which will lead to an accelerated restoration of contingent commissions. We are very excited about the set up for Goosehead for 2023.
Portfolio Adjustments:
During the quarter, we reduced our exposure to Avalara because of the announcement of its being acquired and the stock’s trading up to near the deal price. We also reduced our position in Xometry as the stock ran up. We reduced our Repay position tactically in order to reduce realized taxable gains, but we will add it back in Q4. We added to every other name because of the value throughout the portfolio. Our exposure to Progyny increased as its stock price reacted to the positive earnings. We added most to Goosehead. It faces near-term headwinds, but in our view its current valuation is completely untethered to the real economy reality of the strength, resilience, and growth of its business. Nothing is going to stop the power of superior choice, value, and service that the Goosehead model delivers, and its runway of growth is enormous.
Be Careful What You Ask For:
We recently attended the first ever investor day for a company. Perhaps because of his inexperience hosting such events, the co-founder hardly referred to the lengthy slide presentation and instead spoke entirely off the cuff about the history and future of the business. As you know, we think there’s a lot more wisdom in the words of a successful leader of a great business than there are in a Wall Street sell-side research piece. This business leader did not disappoint. His discussion contained many nuggets that collectively were the equivalent of a 15- minute MBA program.
My favorite pearl of wisdom came when the executive was asked about the company’s expansion plans. The person asking the question referred to the company’s spectacular growth and share gains, record margins and profitability, large geographic expansion opportunity, and incredibly attractive return on recent capital investments. The expectation was set for an announcement of substantial expansion and capital expense. Instead, the business leader (the COO) surprised everyone. Drawing on his real-world experience over decades and with the commonsense practicality and caution that comes from owning 25% of the business, having the business represent his entire fortune, and deep concern for his 9,000 employees the leader simply said, “You can lose a lot more money in times of prosperity than you can when times are tough.”
These words of caution may seem counterintuitive at first, but their value and the danger from not heeding them has never been more manifest than in this most recent cycle fueled by zero interest rates, huge stimulus, COVID related behavioral and supply chain distortions, and mystifying support and valuation of early-stage unprofitable companies. Admittedly this was a challenging environment to manage through full of uncertainty and unknowables, but an incredible number of companies ignored the COO’s advice and invested assuming the punchbowl would never be taken away. Predictably, soul-crushing losses are now following.
There are many ways to set cash on fire during prosperous times. Among the most popular bad practices are: massive expansion of physical plant, capacity and hiring after an unsustainable tailwind; huge buildup in inventory, especially inventory that depreciates quickly or for specific applications that may wither; the ever- popular exciting, ill-timed, overpriced acquisition; and perhaps the dumbest of all, the huge share repurchase done as a concession to some short-term oriented activist or to make financial metrics look good while neglecting the long-term investments needed for the business. And the business school endorsed practice of using cheap debt to fund these happy-time investments only compounds the misery. The funny thing about cheap debt is that it eventually needs to be repaid, and you never know what the rate environment will be like when the debt comes due. Investing with a low return threshold because money is cheap and business is currently strong is a sure way to destroy value, although it is a practice that has fed the families of investment bankers for generations.
Many companies vie for the title of “Poster child of ‘what were you thinking?’ over-investing during times of relative prosperity”. It’s hard to beat News Corp’s 2005 acquisition of Myspace (remember them?) for $580M which they divested a few years later for only $35M (although we’ll see what happens to the $44B Mr. Musk has paid for Twitter...). Bed Bath & Beyond certainly belongs in the pantheon of bad capital allocators. At various times during the last decade, they had a business generating north of $10B in revenues and $1B in free cash flow, a debt free balance sheet, $1B in cash, and an $80 stock price. Despite the ever-present existential threat of Amazon and the move to digital shopping and the need to reinvent the business, the company and its board chose to spend approximately $9B on share repurchases at an average price approaching $50 per share. What do they have to show for it today? A fading brand and business on the road to irrelevance and losing hundreds of millions of dollars every year, about $2B in net debt plus another $1.5B in lease obligations that is effectively debt, and a $2.58 stock price.
But for sheer scale and drama in the world of going crazy with expansion during an unsustainable tailwind, it is hard to outdo the recent performance of Carvana (Ticker: CVNA). Carvana was in the right place at the right time with a leading online car shopping experience when COVID came on the scene. With a surge in demand for used cars and a supply chain driven shortage of new cars, used car prices surged in an unprecedented manner helping all used car dealers. Competitors had yet to catch up with Carvana’s consumer offering, and the company expanded its locations and inventory aggressively even though it lacked the management and operational and logistical infrastructure to make any money on any of these sales on a fully allocated basis, much less support rapid growth. But if ever there was a “this is not going to last forever” event it was the incredible surge in used car values in 2021. The most commonly used proxy for used car prices is the Manheim Index. Over 25 years, from 1995 to late 2020, it went up a total of 25%. In one year, from late 2020 to late 2021, it went up more than 80%. Hungry to grow, Carvana paid top dollar for a huge inventory in a manner so aggressive that most observers believe they significantly distorted the huge used car market. And grow they did, with 2021 revenues more than double that of 2020 which were over 40% higher than 2019. This growth, however, simply exacerbated and fully exposed the serious operational deficiencies including the lack of reconditioning infrastructure to remotely compare to that of competitor CarMax. It turns out, that the answer to losing money on every unit is not to pay top dollar for more units to lose even more money on. Then, as that reality sank in, they took on expensive debt to buy a wholesale auction business in an attempt to start addressing the operational shortcomings. Now, with used car prices regressing, and the economy and used car demand slowing dramatically due to the lack of affordability at these prices, they face an existential threat. On top of the $2.2 billion that they paid for the auction business which will likely need to be written down in some form, the company has managed to burn through nearly $6 billion from operational losses and capital expenditures since 2020 began and debt has swollen from $1.6 billion to over $8 billion, all while operating losses reach new heights. The stock that was $100 before COVID and nearly reached $400 last year has recently traded below $4, an incredible 99% decline in barely more than a year.
The manager’s warning about losing money in times of prosperity and the parables related to those who choose to ignore is directly assimilated into the Owls Nest approach. It is why we invest in great companies during times of headwinds rather when the company is everyone’s favorite and enjoying a cloudless environment. Buying during turbulent times greatly reduces the risk of a sugar-high induced bad allocation decision like the ones mentioned above, and companies can never invest in with higher and more certain returns than they can during tough times. Quality companies with cash-laden balance sheets and multiple vectors of growth can go on offense while weaker competitors bail water as fast as they can to stay afloat. It logically takes some time for the headwind to play out and become a tailwind and fully show the power of the moat-expanding investments made during the challenging times, but they are the best investments a company can make.
The recent dramatic increase in interest rates has punished the stock prices of growth companies, but it happily ushers in a period of rational capital allocation which favors strong leaders with significant growth and share- gaining opportunities. A competitor with seemingly unlimited ability to absorb losses is problematic no matter how untenable the business model is. Those competitors can poach talent, bid up the price of assets and acquisitions, sell below cost, etc. The retrenchment or total elimination of flimsy competitors who were successful in raising and burning money takes a lot of pressure off our companies and will allow for higher return investments in a more benign environment.
Above, we spoke to Carvana in part because we are looking at CarMax (Ticker: KMX). We have not purchased any KMX stock yet, but the set-up is getting very interesting. They face the same economic headwinds, but they run a much more disciplined and operationally sound business. Their digital offering has essentially caught up to Carvana’s, and their balance sheet is infinitely stronger allowing them to go on offense as Carvana, which is laying people off left and right in an attempt to avoid a death spiral, retreats. We aren’t there yet, but stay tuned. The situation is beginning to feel very similar to how it did in 2000 when the environment was tough and Wayne Huizenga’s AutoNation shuttered its used car super store business declaring such a model could not make a profit. He and Wall Street were wrong about the model, and the stock was a 100 bagger off the depressed lows, handily outperforming the likes of Amazon.
You own strong companies that are gobbling share in their markets. Our portfolio has a median debt to cap of only 9.6%, and they do not have bills coming due for dumb investments made when times were good. They have strong organic growth with a median organic growth rate of 20% and are now in a position to invest and augment that growth in the years ahead. Their stock prices might be down for a variety of macro reasons mainly, but their fundamentals and long-term prospects are as strong as ever. Just as the COO’s great advice seemed counter- intuitive, so too is that fact that now when headlines are full of doom and gloom is a great time to put fresh money to work in great companies.
Investment Program:
For the benefit of any first-time readers, the hallmark of the Owls Nest Partners approach is the purchase of industry leading growth companies when a temporary headwind has recoiled the fundamental growth drivers and compressed its multiple. This typically happens as hot money “renters” exit and drive the price down. There is no such thing as a free lunch: we can only receive our requisite value if we accept that our companies will appear “catalyst-less” and uninteresting for some time. We believe we are wildly overcompensated for this modest level of patience, especially since it is in these moments that a company can invest in its own business with the highest returns. There is wonderful optionality associated with a well-run, shareholder friendly, cash- laden company that is able to aggressively put money to work during a temporary headwind.
It is our belief (and experience) that our future outperformance will not be driven by any economic or market forecasting prowess but instead by ten unique investments, each playing out over time. We perceive these investments to have modest downside due to high quality and low expectations, and very significant upside as growth and margin expansion return in spades. We seek reasonable ballast and diversification within the portfolio as a result of our natural conservatism (strengthened by our co-investment alongside clients) and our predisposition to avoid crowded trades and instead invest in temporarily out of favor areas.
Final Thoughts:
We hope you and your family remain safe and well.
More than ever, we thank you for your support and for choosing to have your money working alongside ours.
Gratefully,
Philip & the Owls Nest Partners team
Disclaimer
In General: This disclaimer applies to this document and the verbal or written comments of any person presenting it. This document has been prepared by Owls Nest Partners IA, LLC as Investment Adviser (the “Adviser”) of Owls Nest Partners Concentrated Long Only SMA (the “Strategy”). By receiving this document you acknowledge that you are an investor in the Strategy, or a prospective investor who is known to the Adviser, and that you meet all regulatory definitions of “Accredited Investor” and “Qualified Client,” in order to be considered a prospective client of the Adviser. The information included herein reflects current views of the Adviser only, is subject to change, and is not intended to be promissory or relied upon. There can be no certainty that events will turn out as the Adviser may have opined herein.
No offer to purchase or sell securities: This document does not constitute an offer to sell (or solicitation of an offer to buy) any security and may not be relied upon in connection with the purchase or sale of any security.
No reliance, no update and use of information: You may not rely on this document as the basis upon which to make an investment decision. To the extent that you rely on this document in connection with any investment decision, you do so at your own risk. This document is being provided in summary fashion and does not purport to be complete. The information in this document is provided you as of the dates indicated and the Adviser does not intend to update information after its distribution, even in the event the information becomes materially inaccurate.
Knowledge and experience: You acknowledge that you are knowledgeable and experienced with respect to the financial, tax and business aspects of this presentation and that you will conduct your own independent financial, business, regulatory, accounting, legal and tax investigations with respect to the accuracy, completeness and suitability of this information, should you choose to use or rely on this document, at your own risk, for any purpose.
No tax, legal or accounting advice: This document is not intended to provide and should not be relied upon for (and you shall not construe it as) accounting, legal, regulatory, financial or tax advice, or investment recommendations. Any statements of U.S. federal tax consequences contained in this document were not intended and cannot be used to avoid penalties under the U.S. Internal Revenue Code or to promote, market or recommend any tax-related matters addressed herein.
Confidential information and distribution: By accepting receipt or reading any portion of this document, you agree that you will treat all information contained herein confidentially. Any reproduction or distribution of this document or any related marketing materials, as a whole or in part, or the disclosure of the contents hereof, without the prior written consent of the Adviser, is prohibited.
Suitability: Any investment program involves a high degree of risk and is suitable only for sophisticated investors who meet certain other suitability standards.
Investment strategies, market conditions and risk disclosures: Notwithstanding the general objectives and goals described in this document, readers should understand that the Adviser is not limited with respect to the types of investment strategies it may employ or the markets or instruments in which it may invest. Over time, markets change and the Adviser will seek to capitalize on attractive opportunities wherever they might be. Depending on conditions and trends in securities markets and the economy generally, the Adviser may pursue other objectives or employ other techniques it considers appropriate and in the best interest of the Fund. No representation or warranty is made as to the efficacy of any particular strategy or actual returns that may be achieved.
Projections: This document may contain certain “forward-looking statements,” which may be identified by the use of such words as “believe,” “expect,” “anticipate,” “should,” “planned,” “estimated,” “potential” and other similar terms. Examples of forward-looking statements include, but are not limited to, estimates with respect to financial condition, results of operations, and success or lack of success of the Strategy’s investment strategy. All are subject to various factors, including, but not limited to general and local economic conditions, changing levels of competition within certain industries and markets, changes in interest rates, changes in legislation or regulation, and other economic, competitive, governmental, regulatory and technological factors affecting a portfolio’s operations that could cause actual results to differ materially from projected results.
PAST PERFORMANCE IS NOT INDICATIVE OF FUTURE RESULTS
Disclosures
- Performance presented from inception through September 2020 is for a representative account of the Owls Nest Partners Concentrated Long Only SMA strategy (the “Strategy”). As of October 2020, performance is for a composite of separately managed accounts managed in accordance with the Strategy (the “Composite”). Performance is presented gross and net of all fees, as of the date listed at the top of this document. The fees applied are the prevailing fees of the Strategy at the time such performance was generated. From inception to the date of this document, the fee structure applied is a 1% annual management fee, and 15% performance fee that is charged only on the outperformance of the Strategy to the Benchmark (as defined below), and only after five years. Performance fees are accrued monthly. The vehicle for the Strategy is a separately managed account. All performance is calculated by the Adviser. Further information regarding the Strategy or the Composite can be provided upon request. The Adviser does not claim compliance with the GIPS reporting standards and the performance presented herein has not been audited or verified by any third-party. The Russell 2000 Total Return Index (the “Benchmark”) is a broad market index that is presented for comparative purposes as the performance benchmark to the Fund. The Benchmark is an unmanaged index consisting of the smallest 2000 stocks in the Russell 3000 Index. The stocks are issued in the United States, and the Benchmark includes the reinvestment of all dividends and income. Because the Benchmark is unmanaged, it assumes no transaction costs, management and performance fees, or other expenses. Unlike the Fund, it contains only domestic companies and is rebalanced monthly. Therefore, while the Benchmark contains publicly traded companies, it does not purport to represent an exact performance comparison to the Strategy. It is not possible to invest directly in an index, such as the Benchmark.
- The Russell 2000 Total Return Index is the performance benchmark for the Strategy (the “Benchmark”). The Benchmark is a domestic equity market index of the 2,000 smallest companies by market capitalization in the Russell 3000 Index. Because the Benchmark is unmanaged, it assumes no transaction costs, management fees or other expenses. The calculation of the benchmark return includes the reinvestment of all dividends. It is not possible to invest directly in an index, such as the Benchmark, and therefore it is presented here for information purposes only.

