

- Responsible for new idea generation; portfolio construction; risk management; due diligence
- 25+ years overseeing concentrated small-cap portfolios, on behalf of the most sophisticated allocators in the United States
- Previously: Founder, Endowment Capital Group; Portfolio Manager, Downtown Associates; Analyst, W.H. Newbold’s Son & Company
- University of Pennsylvania, Wharton School, B.S. 1986
- Married to Isabella, 3 sons, 3 daughters, 2 dogs
by Owls Nest Partners on Sep 30, 2019
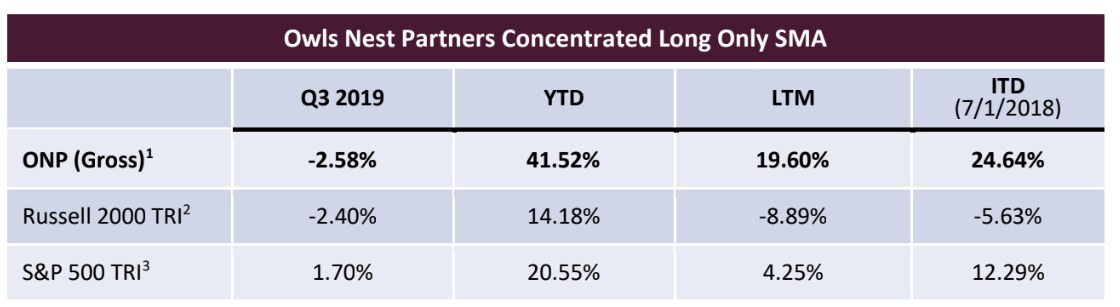
Performance:
Investment Program:
The hallmark of the Owls Nest Partners approach is the purchase of industry leading growth companies when a temporary headwind has recoiled the fundamental growth drivers and compressed its multiple. This typically happens as hot money “renters” exit and drive the price down. There is no such thing as a free lunch: we can only receive our requisite value if we accept that our companies will appear “catalyst-less” and uninteresting for some time. We believe we are wildly overcompensated for this modest level of patience, especially since it is in these moments that a company can invest in its own business with the highest returns. There is wonderful optionality associated with a well-run, shareholder friendly, cash-laden company that is able to aggressively put money to work during a temporary headwind.
It is our belief (and experience) that our future outperformance will not be driven by any economic or market forecasting prowess but instead by ten unique investments, each playing out over time. We perceive these investments to have modest downside due to high quality and low expectations, and very significant upside as growth and margin expansion return in spades. We seek reasonable ballast and diversification within the portfolio as a result of our natural conservatism (strengthened by our co-investment alongside clients) and our predisposition to avoid crowded trades and instead invest in temporarily out of favor areas.
Holdings as of 9/30/2022:
We ended Q3 2019 more than 97% invested in nine companies. The current holdings are as follow (in alphabetical order):
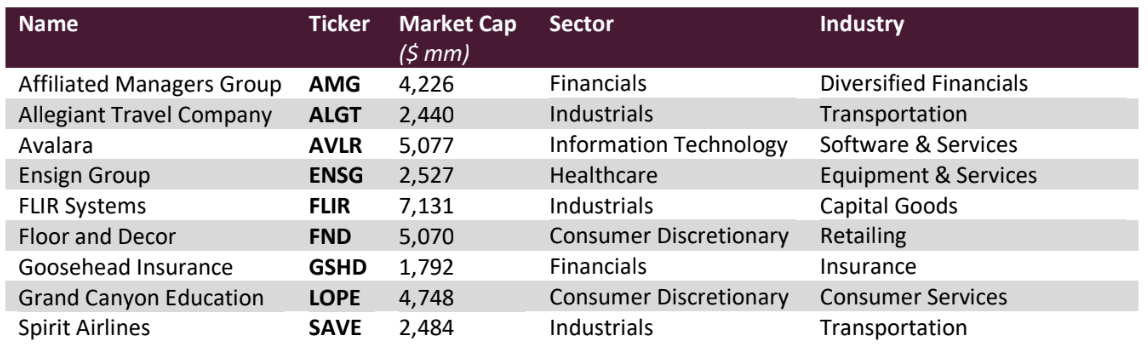
Median Total Debt/Market Cap: 10.8%
Median Market Cap: $4,226 million
1Past performance is not indicative of future results. All returns are presented gross of fees and are preliminary, unaudited, figures that are subject to change. Actual client returns may be different from returns presented herein.
Quarterly Attribution:
During the quarter, five of the eleven companies we owned at some point during the quarter were positive contributors, while six detracted from performance. In order of largest impact to smallest, our gainers were Floor & Decor (FND), Goosehead Insurance (GSHD), Allegiant Travel (ALGT), Ross Stores (ROST) and Fastenal (FAST). The decliners, also in order of largest impact to least, were Grand Canyon Education (LOPE), Ensign Group (ENSG), Affiliated Managers Group (AMG), Avalara (AVLR), FLIR Systems (FLIR), and new name, Spirit Airlines (SAVE). In simplest terms, Grand Canyon accounted for 88% of the quarter’s retracement, and the rest was close to a wash. We are very enthusiastic about Grand Canyon and added appreciably to the position during the quarter. While it was a volatile quarter for some of the stocks, it was a boring, business-as-usual quarter fundamentally for the portfolio companies as a whole.
Portfolio Adjustments:
We had several changes in the portfolio which are discussed below. With gratitude for their contribution to our performance, we sold Ross Stores and Fastenal. As usual, we added to or trimmed some positions based primarily on fundamental developments or market action. We also added a new position, Spirit Airlines.
Ross Stores, Inc. (ROST):
Ross is and will remain a cash-spewing share gainer over the long-term, and a very solid case can be made for our continuing to hold it. However, the fact is that as we looked at the rest of the portfolio and pipeline, Ross just couldn’t compete in terms of growth, “coiledness” of key drivers and discount to our target price and DCF value.
While we owned Ross for the Long Only SMA program, Ross paid a ~1% dividend and its share price climbed ~25% while the Russell 2000 TRI was down ~8%. During that same time the XRT retail index was down more than 18%.
Ross’s success reinforces one of the great advantages of our model. At a time when others followed the easy and widely prescribed path of not owning or even shorting a broad sector (brick and mortar retailers), our concentrated model allowed us to buy the quality grower who is contributing to, and actually benefitting from, the death spiral of its competitive peers.
Much of our ROST thesis centered around multiple expansion: our view being that this is a great and durable business due to unique sourcing and the un-Amazonable economics of $10 fashion apparel items, and that people will wake up to that. That thesis has largely played out as the multiple of sales has expanded from a little more than 1.5X to more than 2X, and the multiple of EBITDA has expanded from high single digits to mid-teens.
Fastenal Company (FAST):
In absolute terms, the sale of Fastenal will almost certainly prove to be a mistake. They still have ample room to grow in a very large market, and their on-site strategy is spot on and plays to their unique strengths.
However, like Ross Stores, when compared to the rest of the portfolio, Fastenal does not have the same intermediate term potential. This is due in some part to the volatility in Q3 which thwacked the share prices of some of our most exciting companies but also due to Fastenal’s great performance since we first bought it. While we owned Fastenal for the Long Only SMA program, Fastenal paid a ~2.5% dividend and its share price climbed ~38%, while the Russell 2000 TRI was down ~3%.
Our Fastenal thesis has not entirely played out yet, and it is very possible, if not likely, that we will own Fastenal again. Our only disappointment relative to our thesis relates to our love of the upside possible when a clearly superior business model is combined with an under-levered balance sheet. Our hope was that Fastenal would be able to acquire a couple meaningful players to extend their strength and reach into new geographic regions and product categories. The availability of cheap capital and the willingness, actually eagerness, of private equity firms to pay “irrational” prices (from the perspective of management – “I have all the synergies, and they have none, yet they paid a multiple of EBITDA five turns higher than I could responsibly pay, and I have access to pretty cheap capital too.”) has made such acquisitions impossible.
In time, there may be an economic slowdown, gross margin compression, investor fright related to the industrial economy, and some shock to the system that results in PE firms leaving the arena. That would be a wonderful time to own Fastenal again.
Spirit Airlines, Inc. (SAVE):
Relying on your “brand” is so 1980s. Just ask Kraft Heinz shareholders. In this age of quick price comparison and diminished brand loyalty, what is undeniably hip and valuable is achieving the lowest cost structure in an industry and using that strength to offer great value to your customers.
The U.S. leisure traveler has spoken and made it clear that he/she values low fares above all else. At the same time, unprecedented consolidation has transformed the airline industry from a brutally competitive capital dumpster fire into a semi-rational near oligopoly capable of earning good returns and sustaining mostly reasonable pricing. Hence, an enormous opportunity has opened up for Ultra Low-Cost Carriers (ULCCs), with Spirit Airlines being the most aggressive and lowest cost.
The legacy airlines have enormous brand awareness and generally large and loyal business traveler customer bases to which they need to cater. Spirit, however, has every other possible advantage on its side of the ledger when asking how to build the best model to serve leisure air customers.
Each will be explained in more detail below, but the laundry list of cost structure advantages includes “juniority” of pilots and labor, a uniform and young fleet, greater seat density, lower airport costs, controlling its own distribution and not relying on expensive third parties. All of these combine to create an airline whose Cost per Available Seat Mile ex fuel (CASMx) is less than half that of the legacy carriers. Further, one of the great changes in the industry over the last decade relates to the Southwest Airlines, who has matured and can no longer compete with low fares given their CASMx being approximately 40% higher than Spirit’s. This cost advantage allows Spirit to earn very attractive returns while offering fares on average more than 35% below the legacy carriers.
And Spirit’s double-digit top-line growth will assure the virtuous low-cost flywheel keeps on turning.
Please skip this long paragraph in case you don’t care about specifics of airline cost structures. “Juniority” relates to the benefit from adding less tenured pilots and flight attendants to support the company’s growth, mitigating inflationary unit cost pressure of an aging workforce. Union contracts that have big escalators based on tenure as opposed to performance are as inescapable as the math that shows Spirit’s advantage in being a young airline and adding young pilots. A uniform and young fleet of Airbus aircraft has better fuel efficiency, less maintenance costs, allows for interchangeable flight crews, maintenance crews and spare parts, and requires less training costs. High seat density carries important benefits because, like a carpool, the more people there are, the more who can share in the cost, and the less everyone has to pay. By packing in 180+ seats on an Airbus A320, Spirit does not have to raise price as much as the legacies, who put 145-150 seats on that same type of plane, when labor or fuel rates increase. Of course, a legacy airline could do the same thing, but doing so would risk alienating the core and highly profitable business traveler. Spirit has 4 key factors that contribute to lower airport costs – 1) high utilization of the planes typically with 9-10 flights out of a gate vs. 5-6 for a legacy; 2) leisure passengers are more flexible with flying times to capture a lower price which allows Spirit to fly at times like 10pm when the airport is less utilized and the airports are aggressive with rates for getting traffic in at underutilized times; 3) acquiring slots in spaces that are lower cost because they may lack abundant concessions or have not been updated recently; and 4) ability to fly out of secondary airports whose rates are significantly lower. Spirit cleverly never signed a full content deal with the online travel agencies (OTAs e.g. Expedia). This sort of arrangement precludes other carriers from offering lower prices than available through the OTA and forces them to absorb the OTA cost. This freedom has allowed Spirit to fully control its own distribution, in turn lowering costs and collecting important customer data which helps on ancillary revenue performance and website personalization.
None of this is to say that legacy airlines will go away. Spirit will almost never steal an expense-account-toting business traveler from American or Delta. But as the sayings go, it is difficult to be all things to all people or to serve two masters. And while the ULCCs will absolutely gobble up share in the leisure market, they also grow the market stimulating travel that wouldn’t happen in a regime of more expensive fares.
Spirit has a long runway of growth. The best evidence might be drawn from Europe where ULCC’s make up close to 20% of the industry, whereas in the U.S. it is still closer to 5%.
These positive virtues drove SAVE stock to a price above $80 in 2014 and 2015, at which point it sold at a multiple of sales between 2.5X and 3X. But the momentum guys who owned it then soon learned that Spirit was overearning. Not only was the company benefitting from a sharp decline in oil prices, but the company was underinvesting in operations and customer satisfaction.
Today, we are presented with the inverse situation. The significant investments in operational quality which contributed to a more than 7% reduction in EBIT margin have been made and now can be leveraged. The result was that by Q1 2019 Spirit could boast of an industry leading completion rate (98.9%) and on-time rate (82.6%). Customer satisfaction correspondingly soared. And while these investments have firmed up the foundation for the next wave of profitable growth, their costs plus a whole host of shorter duration issues that have wreaked havoc with recent results have pushed investor sentiment to all-time lows. For example, construction at Fort Lauderdale Airport, Spirit’s largest destination, has increased costs as the company has had to increase the number of crew members and spares while limiting throughput. Opportunistically adding new routes, especially in gate-constrained markets, has also hit margins as these new routes ramp up. An increase in network planning aggressiveness in the summer backfired when unusually bad weather in key markets combined with fewer spare aircraft drove costs from operational inefficiency much higher. Hurricane Dorian was just unnecessary roughness. As a result, we were able to buy Spirit below $37 and at 6X EBITDA and only 1.25X sales.
And this too shall pass. Soon enough, the issues above will be in rear-view mirror and the congenial benefit from its operational and customer satisfaction gains, the maturation of new routes, and untapped opportunities with ancillary revenue, base fare, loyalty program, and credit card will come to the fore.
But, let’s not kid ourselves. One of the uses of all the money we think we’ll make from buying Spirit here is to be able to afford to fly the family in first class on a legacy guy. Just once.
Closing Thoughts:
We love what we do because we spend our time talking to suppliers, customers, competitors, etc., so we can put the mosaic together and figure out the long-game. It’s fun and can drive great financial returns, but it can really only be done most effectively within a concentrated portfolio and with limits to capacity. Which is exactly why we think this analysis applies to our own business. We think we have the better mousetrap that other players cannot compete with because they have scaled and are trying to be all things to all people, which at some point leads to index-hugging and mediocrity. With their size, our larger peers will generate a lot more management fees than we do and will laugh all the way to the bank. But, we believe we will perform much better for our clients, which is the metric we care most about. And in the long run, maybe some very interesting things will happen for everyone.
Thank you for the support and the decision to have your money working alongside ours.
Gratefully,
Philip & the Owls Nest Partners team
Disclaimer
In General: This disclaimer applies to this document and the verbal or written comments of any person presenting it. This document has been prepared by Owls Nest Partners IA, LLC as Investment Adviser (the “Adviser”) of Owls Nest Partners Concentrated Long Only SMA (the “Strategy”). By receiving this document you acknowledge that you are an investor in the Strategy, or a prospective investor who is known to the Adviser, and that you meet all regulatory definitions of “Accredited Investor” and “Qualified Client,” in order to be considered a prospective client of the Adviser. The information included herein reflects current views of the Adviser only, is subject to change, and is not intended to be promissory or relied upon. There can be no certainty that events will turn out as the Adviser may have opined herein.
No offer to purchase or sell securities: This document does not constitute an offer to sell (or solicitation of an offer to buy) any security and may not be relied upon in connection with the purchase or sale of any security.
No reliance, no update and use of information: You may not rely on this document as the basis upon which to make an investment decision. To the extent that you rely on this document in connection with any investment decision, you do so at your own risk. This document is being provided in summary fashion and does not purport to be complete. The information in this document is provided you as of the dates indicated and the Adviser does not intend to update information after its distribution, even in the event the information becomes materially inaccurate.
Knowledge and experience: You acknowledge that you are knowledgeable and experienced with respect to the financial, tax and business aspects of this presentation and that you will conduct your own independent financial, business, regulatory, accounting, legal and tax investigations with respect to the accuracy, completeness and suitability of this information, should you choose to use or rely on this document, at your own risk, for any purpose.
No tax, legal or accounting advice: This document is not intended to provide and should not be relied upon for (and you shall not construe it as) accounting, legal, regulatory, financial or tax advice, or investment recommendations. Any statements of U.S. federal tax consequences contained in this document were not intended and cannot be used to avoid penalties under the U.S. Internal Revenue Code or to promote, market or recommend any tax-related matters addressed herein.
Confidential information and distribution: By accepting receipt or reading any portion of this document, you agree that you will treat all information contained herein confidentially. Any reproduction or distribution of this document or any related marketing materials, as a whole or in part, or the disclosure of the contents hereof, without the prior written consent of the Adviser, is prohibited.
Suitability: Any investment program involves a high degree of risk and is suitable only for sophisticated investors who meet certain other suitability standards.
Investment strategies, market conditions and risk disclosures: Notwithstanding the general objectives and goals described in this document, readers should understand that the Adviser is not limited with respect to the types of investment strategies it may employ or the markets or instruments in which it may invest. Over time, markets change and the Adviser will seek to capitalize on attractive opportunities wherever they might be. Depending on conditions and trends in securities markets and the economy generally, the Adviser may pursue other objectives or employ other techniques it considers appropriate and in the best interest of the Fund. No representation or warranty is made as to the efficacy of any particular strategy or actual returns that may be achieved.
Projections: This document may contain certain “forward-looking statements,” which may be identified by the use of such words as “believe,” “expect,” “anticipate,” “should,” “planned,” “estimated,” “potential” and other similar terms. Examples of forward-looking statements include, but are not limited to, estimates with respect to financial condition, results of operations, and success or lack of success of the Strategy’s investment strategy. All are subject to various factors, including, but not limited to general and local economic conditions, changing levels of competition within certain industries and markets, changes in interest rates, changes in legislation or regulation, and other economic, competitive, governmental, regulatory and technological factors affecting a portfolio’s operations that could cause actual results to differ materially from projected results.
PAST PERFORMANCE IS NOT INDICATIVE OF FUTURE RESULTS
Disclosures
- All “portfolio” information presented is for the Owls Nest Partners Concentrated Long Only SMA (the “Strategy”). Such data represents preliminary, unaudited, figures that are subject to change. The Adviser prepares final month-end and quarterly performance figures for the Strategy, which therefore represent its own internal, unaudited estimates of performance. Because the Strategy is only offered via separate account or SMA/UMA platforms, fees will be different for each client of the Strategy. Therefore, all performance returns are presented gross of all fees and expenses. For further information regarding Strategy performance, please contact the Adviser at info@owlsnestpartners.com, or by calling 484-352-1110.
- The Russell 2000 Total Return Index (the “Benchmark”) is a broad market index that is presented for comparative purposes as the performance benchmark to the Fund. The Benchmark is an unmanaged index consisting of the smallest 2000 stocks in the Russell 3000 Index. The stocks are issued in the United States, and the Benchmark includes the reinvestment of all dividends and income. Because the Benchmark is unmanaged, it assumes no transaction costs, management and performance fees, or other expenses. Unlike the Fund, it contains only domestic companies and is rebalanced monthly. Therefore, while the Benchmark contains publicly traded companies, it does not purport to represent an exact performance comparison to the Strategy. It is not possible to invest directly in an index, such as the Benchmark
- The Standard & Poor’s 500 Index is a domestic equity market index that is presented for comparative purposes only (the “S&P 500”). The S&P 500 is an unmanaged index consisting of largest 500 companies by market capitalization having common stock listed on the NYSE or NASDAQ. The S&P 500 index components and their weightings are determined by S&P Dow Jones Indices. Because the S&P 500 is unmanaged, it assumes no transaction costs, management and performance fees, or other expenses. It is not possible to invest directly in an index, such as the S&P 500. In instances where insufficient data is available for the Benchmark, the S&P 500 has been used as a proxy for the broader domestic equity market.

